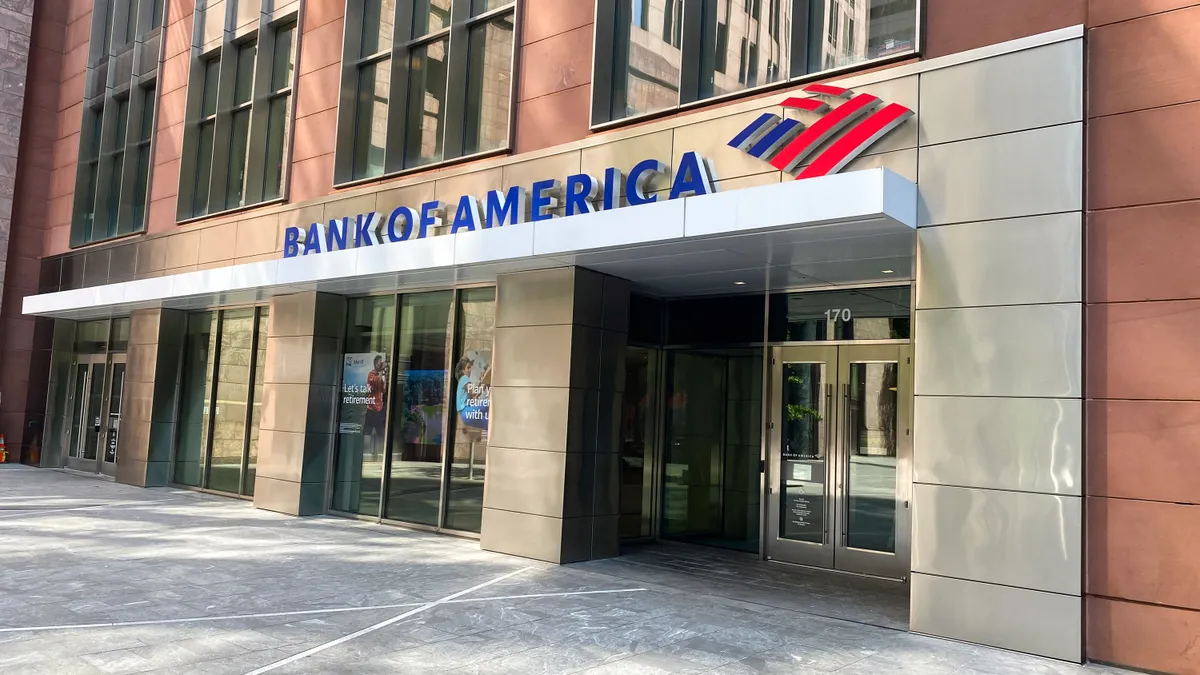
Bank of America, HSBC and ING have entered November with relative strength index readings below 30 following declines over the past month, according to a Benzinga market screen.
The readings place all three in territory commonly described as oversold, attracting attention from traders looking for signs that selling pressure may ease.
However, a low RSI measures recent price momentum. It does not establish that a company is undervalued or that its shares are about to rise. Earnings expectations, business performance and broader market conditions remain important to the outlook.
Oversold Financial Stocks at a Glance
The following figures reflect Benzinga’s reported snapshot, including closing prices for Tuesday, November 3, 2026. They are historical figures rather than live quotations.
| Company | NYSE ticker | Reported RSI | Approximate one-month decline | November 3 closing price | Reported 52-week low |
|---|---|---|---|---|---|
| Bank of America | BAC | 27.2 | 8% | $49.66 | $46.12 |
| HSBC Holdings | HSBC | 21.8 | 13% | $84.49 | $67.56 |
| ING Groep | ING | 26.9 | 11% | $30.90 | $24.35 |
HSBC had the lowest RSI and largest reported monthly decline among the three. That indicates weaker recent momentum within this snapshot, rather than a stronger likelihood of an eventual rebound.
Bank of America: Shares Slip Around 8% Over a Month
Bank of America’s stock recorded an RSI of 27.2 after falling approximately 8% over the preceding month.
Shares nevertheless finished Tuesday slightly higher, gaining 0.2% to close at $49.66. The reported 52-week low stood at $46.12.
Benzinga also highlighted the bank’s November 3 appointment of Josh Barnes as Knoxville market president. While the appointment represents a local leadership development, the report does not establish a connection between that announcement and the stock’s recent performance.
For those following BAC, the immediate question is whether the small daily gain develops into a more sustained period of price stability. One positive session following a monthly decline provides limited evidence of a change in direction.
The stock’s low RSI therefore identifies recent selling pressure, while leaving the timing and strength of any recovery uncertain.
HSBC: Lowest RSI Among the Three Banks
HSBC’s reported RSI of 21.8 placed it furthest below the conventional oversold threshold.
Its shares fell approximately 13% over the past month and declined another 1.7% on Tuesday, closing at $84.49. The reported 52-week low was $67.56.
Among recent business developments, Benzinga cited an October 30 blockchain-based investment pilot involving HSBC, Uber and Franklin Templeton. The initiative aimed to generate additional returns on idle corporate cash through weekend trading.
HSBC’s quarterly results also provide context beyond its share-price performance. The bank reported third-quarter pretax profit of $9.6 billion, up 32% from a year earlier. It approved a third interim dividend of $0.10 per ordinary share and announced its intention to initiate a further share buyback of up to $1 billion.
Those figures illustrate why a technical screen is only one part of assessing a bank. A declining share price can coexist with higher reported profits, as investors also weigh expectations, the composition of earnings and future prospects.
ING: Earnings Disappointment Adds to Pressure
ING posted an RSI of 26.9 after an approximately 11% monthly decline.
Its NYSE-listed shares fell 1.5% on Tuesday to close at $30.90, compared with a reported 52-week low of $24.35.
Benzinga identified the bank’s October 29 third-quarter earnings release as a recent development, reporting that earnings per share came in below expectations.
An earnings miss gives investors a business-related issue to examine alongside the stock’s momentum. The significance depends on what drove the shortfall and whether it changes expectations for subsequent quarters.
Although the source also referenced a potential breakout signal, such an alert does not confirm that a breakout has occurred or that subsequent gains will follow.
What an RSI Below 30 Actually Means
The relative strength index compares recent gains and losses to describe price momentum on a scale from zero to 100. Readings below 30 are commonly classified as oversold.
A stock can remain below that threshold during a prolonged decline. Likewise, a recovery in RSI can reflect slowing selling pressure without immediately producing a substantial price rebound.
The supplied screen does not specify its RSI calculation period or chart interval. Readers comparing these figures with another platform may therefore encounter different readings, particularly as prices change.
Bank of America, HSBC and ING qualify for this watchlist because of their reported momentum readings. Whether any of them recovers during November will depend on developments beyond the indicator, including earnings expectations and the direction of trading after the November 3 snapshot.
read Also:Compound Interest in Kenya: How to Make Your Savings Work Over Time